433Mhz Test Using Raspberry Pi
Fleeting433Mhz test using raspberry pi, FS1000A and mx-rm-5v
trying https://www.instructables.com/Super-Simple-Raspberry-Pi-433MHz-Home-Automation/
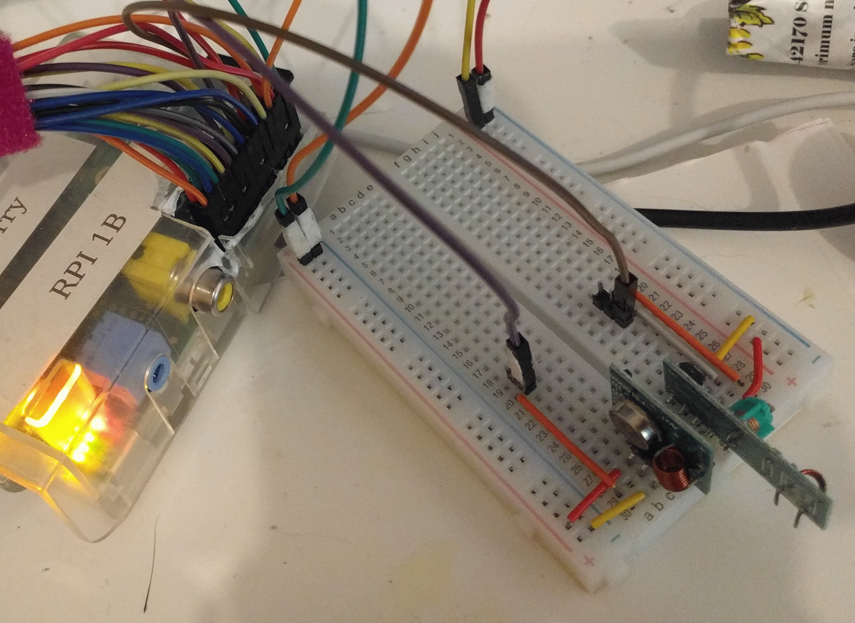
I plugged the receiver on the GPIO 4 and the transmitter on the GPIO 17.

Using the given code, adjusted to my pins.
from datetime import datetime
import RPi.GPIO as GPIO
from collections import Counter
MAX_DURATION = 10
RECEIVE_PIN = 4

def capture():
    global RECEIVED_SIGNAL
    RECEIVED_SIGNAL = [[], []] # [[time of reading], [signal reading]]
    GPIO.setmode(GPIO.BCM)
    GPIO.setup(RECEIVE_PIN, GPIO.IN)
    cumulative_time = 0
    beginning_time = datetime.now()
    print('**Started recording**')
    while cumulative_time < MAX_DURATION:
        time_delta = datetime.now() - beginning_time
        RECEIVED_SIGNAL[0].append(time_delta)
        RECEIVED_SIGNAL[1].append(GPIO.input(RECEIVE_PIN))
        cumulative_time = time_delta.seconds
        print('**Ended recording**')
        print(len(RECEIVED_SIGNAL[0]), 'samples recorded')
        GPIO.cleanup()
        print('**Processing results**')
    for i in range(len(RECEIVED_SIGNAL[0])):
        RECEIVED_SIGNAL[0][i] = RECEIVED_SIGNAL[0][i].seconds + RECEIVED_SIGNAL[0][i].microseconds/1000000.0
        print(f"Received: {Counter(RECEIVED_SIGNAL[1])}")

def dump(path="data/a.csv"):
    Path(path).write_text("".join(f"{a},{b}\n" for a, b in zip(*RECEIVED_SIGNAL)))

def plot():
    import matplotlib.pyplot as pyplot
    print '**Plotting results**'
    pyplot.plot(RECEIVED_SIGNAL[0], RECEIVED_SIGNAL[1])
    pyplot.axis([0, MAX_DURATION, -1, 2])
    pyplot.show()

def main():
    capture()
    plot()

if __name__ == "__main__":
    main()
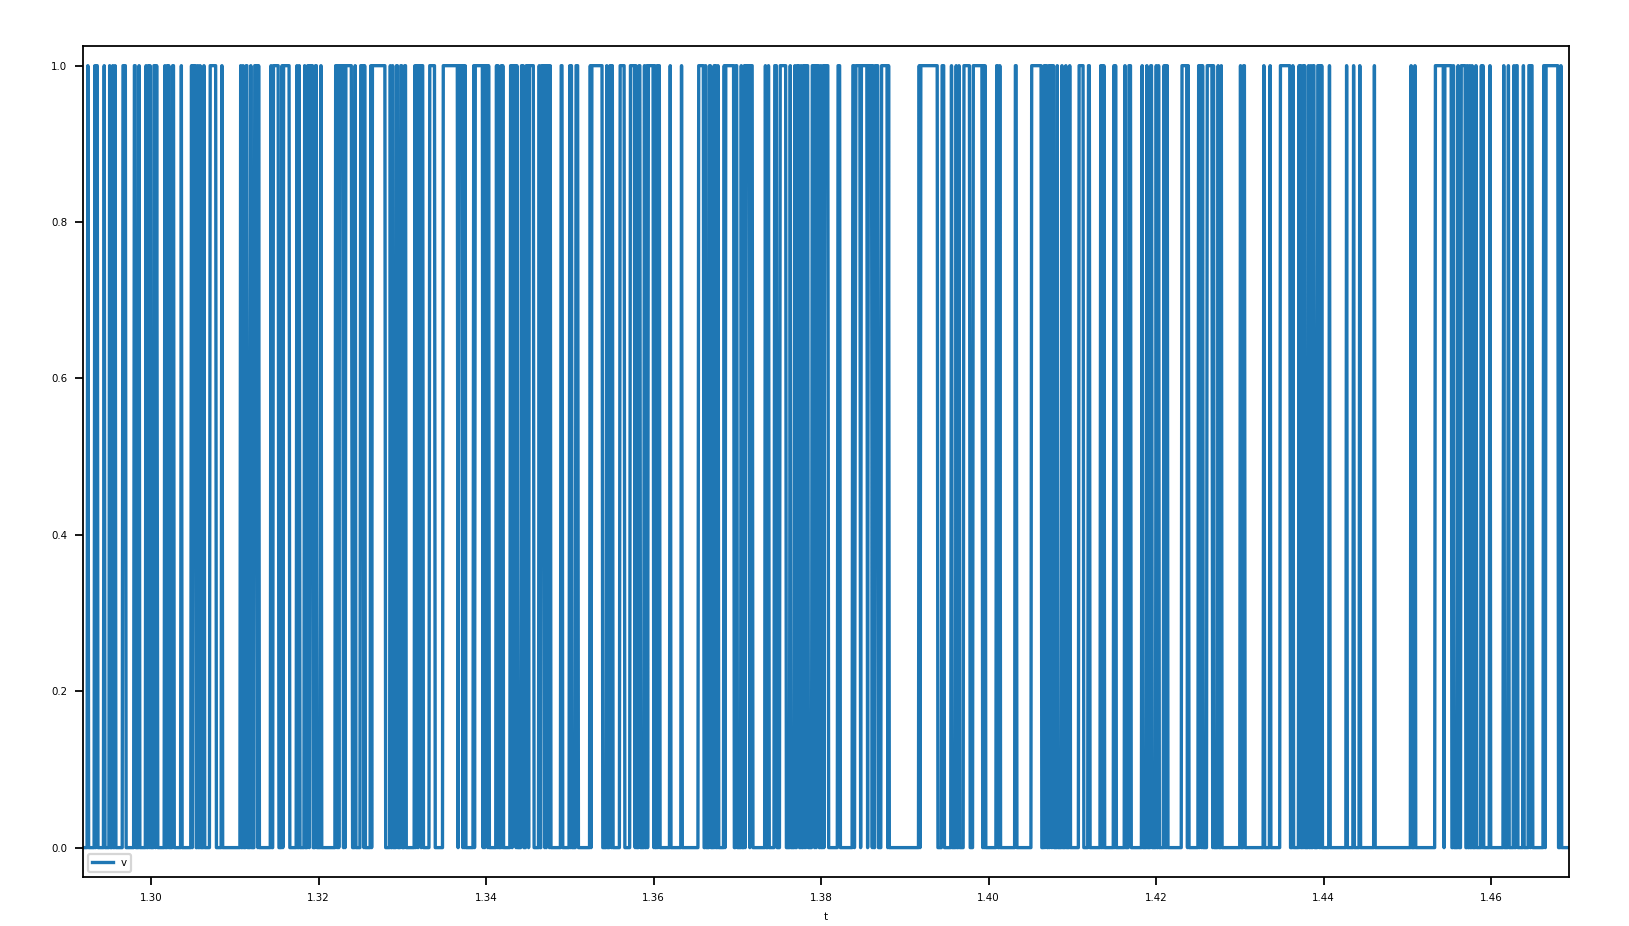
trying without doing anything with my devices
I already get a lot of data.

There are maybe some devices that send those data and that I don’t know about.
trying a base scenario without anything
I try unplugging the receiver.
trying with another library
https://www.instructables.com/RF-433-MHZ-Raspberry-Pi/